Three weeks ago I’ve decided to use InfluxDB for some Smart Home data. Here is a short article about my impressions.
Getting it to run on my home server was pretty easy:
$ docker run --rm --name influxdb -d -p 8086:8086 \
  --volume /data/influxdb/influxdb2:/var/lib/influxdb2 \
  --volume /data/influxdb/config.yml:/etc/influxdb2/config.yml \
  influxdb
Of course I first had to figure out these arguments, and how to get that config.yml, but it’s all rather well-documented here.
Once it was running, I started feeding in data from a Python script. That was also really easy, with the guided example directly from the InfluxDB web GUI. I’ve added the necessary code into a script that I already had running every minute – the relevant portions are:
Python code to publish data points into InfluxDB
import influxdb_client
from influxdb_client import InfluxDBClient, Point, WritePrecision
from influxdb_client.client.write_api import SYNCHRONOUS
import traceback, urllib3

influxdb_token = os.getenv('InfluxDB_token', '')
influxdb_org = os.getenv('InfluxDB_org', '')
influxdb_url = os.getenv('InfluxDB_URL', 'http://localhost:8086')
logger_version = "1"

# 'device' is populated by the PyViCare library that accesses
# my heating system's API - something for another blog post ;)
t = device.asFuelCell()

info = {
    "FuelCellPowerProductionCurrent": float(t.getFuelCellPowerProductionCurrent()),
    "FuelCellPowerPurchaseCurrent": float(t.getFuelCellPowerPurchaseCurrent()),
    "FuelCellPowerSoldCurrent": float(t.getFuelCellPowerSoldCurrent()),
    "HotWaterStorageTemperatureBottom": float(t.getHotWaterStorageTemperatureBottom()),
    "HotWaterStorageTemperatureTop": float(t.getHotWaterStorageTemperatureTop())
}

client = influxdb_client.InfluxDBClient(url=influxdb_url, token=influxdb_token, org=influxdb_org)
bucket="smarthome"
write_api = client.write_api(write_options=SYNCHRONOUS)

for field in info:
    point = (
    Point("heating")
    .tag("logger_version", logger_version)
    .field(field, info[field])
    )
    try:
        write_api.write(bucket=bucket, org=influxdb_org, record=point)
        print('- ' + field)
    except urllib3.exceptions.NewConnectionError as e:
        print('\nWARNING: InfluxDB seems to be down:')
        print(''.join(traceback.format_exception(None, e, e.__traceback__)))
        break
    except Exception as e:
        print('\nWARNING: Could not submit ' + field + ' to InfluxDB:')
        print(''.join(traceback.format_exception(None, e, e.__traceback__)))
        pass
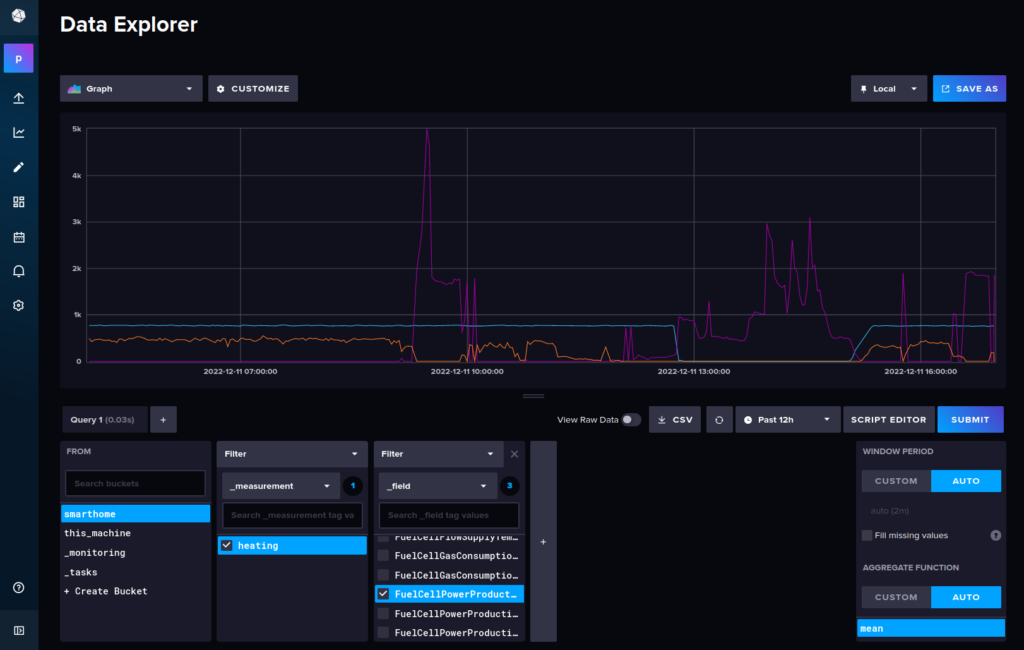
Et voilà, my first queries with Data Explorer within InfluxDB returned results:

After a bit of customizing and then saving the query on a dashboard, I have very beautiful graphs of the data, and so far it has been running very stable and reliably.
However there are two things that started to bother me, namely:
- There is no way to access the dashboards on mobile. I can log in alright, but the dashboard is just empty. Looks like a major bug / missing functionality. If I switch on “desktop site” in the browser (Firefox on Android, but also tried Chrome), I get the same that I get on my desktop. While somehow working, it’s not a really good experience: for example when you zoom in you can no longer “scroll”, because touching a diagram/cell content will interact with it, e.g. moving the cell to another place instead of doing the desired scroll action. I’ve also searched for an app that would let me connect to my InfluxDB and offer a proper mobile experience, but couldn’t find one.
- Downsampling of data doesn’t happen automatically for longer time ranges, and there is no “easy” way to get this working. I absolutely expected from a time series database with integrated visualization to be able to do this out of the box. Because as soon as you have more than a “handful” of data points in the database, queries over longer time ranges cause the client (i.e. the machine running the browser that accesses InfluxDB) to work really hard after executing a query. That’s because all the data points in that range from the database are actually sent to the graphing/rendering engine. So even when I do a “30 days” query for my 5 data points which I sample once a minute (= 216,000 data point entries), InfluxDB won’t reduce that to a more reasonable number. It actually transfers 216,000 data point entries to the browser that tries to graph them in the diagram. Depending on what hardware the browser runs on this can take a while. It would be better if there was a way to dynamically downsample the data, so its resolution matches the use case at hand.
Example: If a graph is rendered on a 1080p screen and covering 50% screen width (1920/2 = 960 pixels), I would assume that 960 data point entries per graph line would suffice. That would reduce the 216,000 points to a mere 4,800. But in InfluxDB, you get 45 data points per pixel, who needs that? And that was only a one-month query. Once I have a year worth of data points, I’ll probably have to wait minutes for the browser to finish its number crunching.
The proposed way is to set up a “cron task” that does the downsampling and copies the values into a separate bucket. Of course I could make this work, but seriously?!
Having said that, it’s still definitely a great tool, and I hope these two issues will be resolved in the near future (or someone tells me what I’ve been doing wrong, which is always a possibility 😉).
Edit (2022-12-12): Fixed downsampling example math, had forgotten that the 216,000 points are for five data points, and would thus be rendered as five graphs, not one.