InfluxDB newcomer’s impressions

Three weeks ago I’ve decided to use InfluxDB for some Smart Home data. Here is a short article about my impressions.

Getting it to run on my home server was pretty easy:

$ docker run --rm --name influxdb -d -p 8086:8086 \
  --volume /data/influxdb/influxdb2:/var/lib/influxdb2 \
  --volume /data/influxdb/config.yml:/etc/influxdb2/config.yml \
  influxdb

Of course I first had to figure out these arguments, and how to get that config.yml, but it’s all rather well-documented here.

Once it was running, I started feeding in data from a Python script. That was also really easy, with the guided example directly from the InfluxDB web GUI. I’ve added the necessary code into a script that I already had running every minute – the relevant portions are:

Python code to publish data points into InfluxDB
import influxdb_client
from influxdb_client import InfluxDBClient, Point, WritePrecision
from influxdb_client.client.write_api import SYNCHRONOUS
import traceback, urllib3

influxdb_token = os.getenv('InfluxDB_token', '')
influxdb_org = os.getenv('InfluxDB_org', '')
influxdb_url = os.getenv('InfluxDB_URL', 'http://localhost:8086')
logger_version = "1"

# 'device' is populated by the PyViCare library that accesses
# my heating system's API - something for another blog post ;)
t = device.asFuelCell()

info = {
    "FuelCellPowerProductionCurrent": float(t.getFuelCellPowerProductionCurrent()),
    "FuelCellPowerPurchaseCurrent": float(t.getFuelCellPowerPurchaseCurrent()),
    "FuelCellPowerSoldCurrent": float(t.getFuelCellPowerSoldCurrent()),
    "HotWaterStorageTemperatureBottom": float(t.getHotWaterStorageTemperatureBottom()),
    "HotWaterStorageTemperatureTop": float(t.getHotWaterStorageTemperatureTop())
}

client = influxdb_client.InfluxDBClient(url=influxdb_url, token=influxdb_token, org=influxdb_org)
bucket="smarthome"
write_api = client.write_api(write_options=SYNCHRONOUS)

for field in info:
    point = (
    Point("heating")
    .tag("logger_version", logger_version)
    .field(field, info[field])
    )
    try:
        write_api.write(bucket=bucket, org=influxdb_org, record=point)
        print('- ' + field)
    except urllib3.exceptions.NewConnectionError as e:
        print('\nWARNING: InfluxDB seems to be down:')
        print(''.join(traceback.format_exception(None, e, e.__traceback__)))
        break
    except Exception as e:
        print('\nWARNING: Could not submit ' + field + ' to InfluxDB:')
        print(''.join(traceback.format_exception(None, e, e.__traceback__)))
        pass

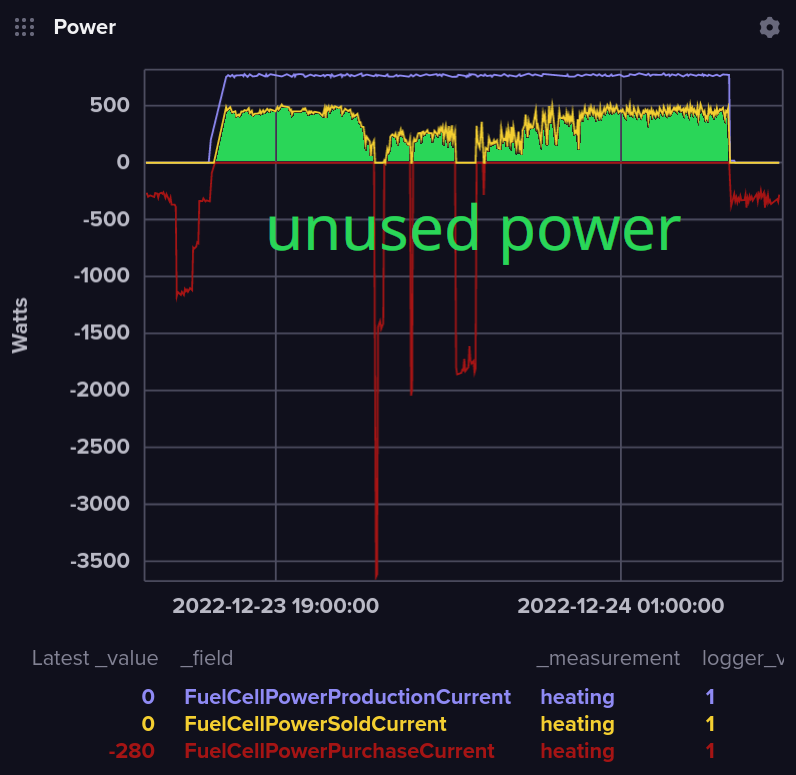
Et voilà, my first queries with Data Explorer within InfluxDB returned results:

Using InfluxDB’s Data Explorer

After a bit of customizing and then saving the query on a dashboard, I have very beautiful graphs of the data, and so far it has been running very stable and reliably.

However there are two things that started to bother me, namely:

  • There is no way to access the dashboards on mobile. I can log in alright, but the dashboard is just empty. Looks like a major bug / missing functionality. If I switch on “desktop site” in the browser (Firefox on Android, but also tried Chrome), I get the same that I get on my desktop. While somehow working, it’s not a really good experience: for example when you zoom in you can no longer “scroll”, because touching a diagram/cell content will interact with it, e.g. moving the cell to another place instead of doing the desired scroll action. I’ve also searched for an app that would let me connect to my InfluxDB and offer a proper mobile experience, but couldn’t find one.
  • Downsampling of data doesn’t happen automatically for longer time ranges, and there is no “easy” way to get this working. I absolutely expected from a time series database with integrated visualization to be able to do this out of the box. Because as soon as you have more than a “handful” of data points in the database, queries over longer time ranges cause the client (i.e. the machine running the browser that accesses InfluxDB) to work really hard after executing a query. That’s because all the data points in that range from the database are actually sent to the graphing/rendering engine. So even when I do a “30 days” query for my 5 data points which I sample once a minute (= 216,000 data point entries), InfluxDB won’t reduce that to a more reasonable number. It actually transfers 216,000 data point entries to the browser that tries to graph them in the diagram. Depending on what hardware the browser runs on this can take a while. It would be better if there was a way to dynamically downsample the data, so its resolution matches the use case at hand.
    Example: If a graph is rendered on a 1080p screen and covering 50% screen width (1920/2 = 960 pixels), I would assume that 960 data point entries per graph line would suffice. That would reduce the 216,000 points to a mere 4,800. But in InfluxDB, you get 45 data points per pixel, who needs that? And that was only a one-month query. Once I have a year worth of data points, I’ll probably have to wait minutes for the browser to finish its number crunching.
    The proposed way is to set up a “cron task” that does the downsampling and copies the values into a separate bucket. Of course I could make this work, but seriously?!

Having said that, it’s still definitely a great tool, and I hope these two issues will be resolved in the near future (or someone tells me what I’ve been doing wrong, which is always a possibility 😉).

Edit (2022-12-12): Fixed downsampling example math, had forgotten that the 216,000 points are for five data points, and would thus be rendered as five graphs, not one.

Getting FRITZ!Box upload/download rate nicely displayed in a KDE Plasma panel

It’s been a while that I’ve been setting up a private computer. For a long time I only had my old laptop, where I had not much motivation to tinker and optimize. Now that I have my new desktop computer (yay!), I’ve spent some time arranging the workspace / desktop. And of course I’m using KDE, as I have been for so many years.

The Plasma 5 system monitor is pretty cool, because it’s very configurable, and each of the graphs can be placed as Plasma widget on the desktop or in any panel. So I set up some nice graphs for SSD I/O, network throughput, CPU, memory, temperatures etc.. But then I thought: Can’t I also get some info from my Internet router, e.g. the current download rate of the whole house (as this PC is by far not the only device using the Internet connection). Or when it last reconnected, and what the external IP address is.

So I looked a bit into the TR-064 protocol and found a really nice Python module – fritzconnection by Klaus Bremer – to interface with my router (an AVM FRITZ!Box 5530 Fiber). It should also work with pretty much any other FRITZ!Box model, which is a very common Internet router throughout Germany. You can simply get it by running pip install fritzconnection.

So after a few minutes I was able to query the desired data from the router with very few lines of code, like so:

os.environ['FRITZ_USERNAME'] = 'user'
os.environ['FRITZ_PASSWORD'] = 'password'
fc = FritzStatus(address='fritz.box')
print('WAN Download: ' + fc.str_transmission_rate[1])

I found that querying it more than once every 5 seconds doesn’t make sense, because it doesn’t update the numbers more often than that. So a loop with a 5 second sleep it is.

But I also wanted to get the data into my nice panel, together with the CPU load etc… And by chance I stumbled over the Do It Yourself Bar – funny name, but it kind of fits: It’s a bar-shaped Plasma widget that you can populate via DBUS messages through any kind of script – typically Shell scripts but of course Python scripts work just as well.

So I modified my “text-only” Python script to send DBUS messages and hooked it into the DIY bar – and suddenly I have the data queried from the router in my KDE panel, with configurable colors and all!

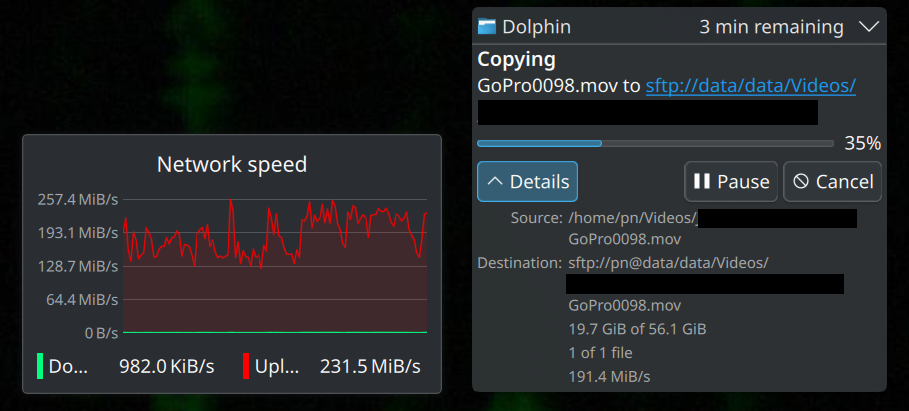
Running a speed test – here you can see the local network adapter’s data and below the Do It Yourself Bar with the FRITZ!Box data (I highlighted it with a yellow frame in this screenshot).

Hovering over the “FRITZ!Box conn. up: …” label also shows the external IP address, and clicking on it would open the browser with the FRITZ!Box’s web interface.

Here is the current Python script and my Pull Request.

#!/usr/bin/python

# Prerequisites:
# - Have a FRITZ!Box Internet router that is reachable at the address http://fritz.box
# - Add a user + password to your FRITZ!Box (via the web interface)
# - Run `pip install fritzconnection` to get the handy Python module by Klaus Bremer
#   (see https://fritzconnection.readthedocs.io)

import os, sys, time
from fritzconnection.lib.fritzstatus import FritzStatus

os.environ['FRITZ_USERNAME'] = 'scriptuser'
os.environ['FRITZ_PASSWORD'] = 'the_password'

fc = None
while not fc:
    try:
        fc = FritzStatus(address='fritz.box')
    except:
        data = '| A | FRITZ!Box not reachable | Have you changed username and password in get-fritz-wan-stats.py? Is your network up? | |'
        os.system('/usr/bin/qdbus org.kde.plasma.doityourselfbar /id_' + sys.argv[1] + ' org.kde.plasma.doityourselfbar.pass \'' + data + '\'')
        pass
    time.sleep(5)

while fc:
    data = '| A | FRITZ!Box conn. up: ' + fc.str_uptime + ' | External IP: ' + fc.external_ip + ' | xdg-open http://fritz.box |'
    data += '| B | WAN Download: ' + fc.str_transmission_rate[1] + '/s | FRITZ!Box WAN Download | |'
    data += '| C | WAN Upload: ' + fc.str_transmission_rate[0] + '/s | FRITZ!Box WAN Upload | |'
    os.system('/usr/bin/qdbus org.kde.plasma.doityourselfbar /id_' + sys.argv[1] + ' org.kde.plasma.doityourselfbar.pass \'' + data + '\'')
    time.sleep(5)

Pretty neat. Thanks a lot to Klaus Bremer and the other fritzconnection authors and wsdfhjxc for making this possible!

Ubuntu 20.04 messes up file modification dates on exfat file systems

Somehow related to my previous post: As of currently – i.e. September 2020 – there is a weird bug in Ubuntu 20.04’s exfat support: When you mount an exfat file system (like the one on pretty much any MicroSD card that you would use in a GoPro), it will not only show all files as exactly one month into the future, but it will even change the modification date to that one month in the future. Thus, if you mount an exfat filesystem two times in a row, all files will have a modification date two months in the future. Very annoying.

Luckily there is an easy workaround: Instead of the built-in (kernel module?) exfat support, just install the packages ‘exfat-fuse’ and ‘exfat-utils’ (i.e. type sudo apt install exfat-fuse exfat-utils in the shell). Once you mount the MicroSD card again, it will be mounted using the fuse driver, which does not mess up the modification dates.

Those dates that have already been messed up though, need to be fixed. I’ve created a small script that can do that. Download it (here), chmod +x it and then run it with the file name(s) of the affected files as parameter(s). If the date has already been messed up to more than one month into the future, just run the script multiple times.